@tsichart/core is a powerful JavaScript library for visualizing time series data with interactive
charts. Built with TypeScript and D3.js, it provides 20+ pre-built components including line charts,
bar charts, heatmaps, scatter plots, and more.
Filter by:
Basic Charts
Render a basic line, bar, and heatmap chart
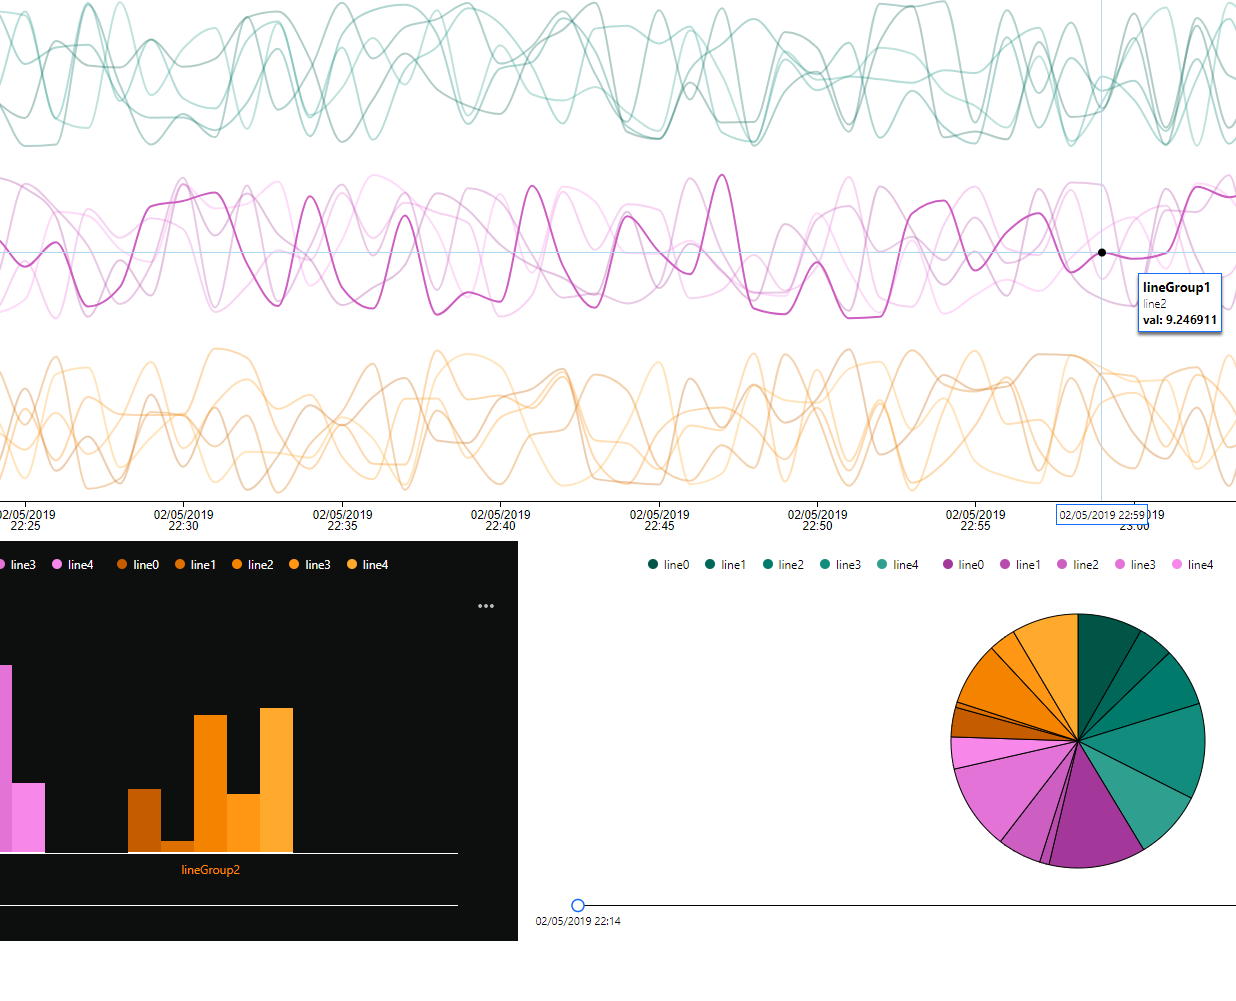
Multiple Series Types
Render a line chart with multiple series types
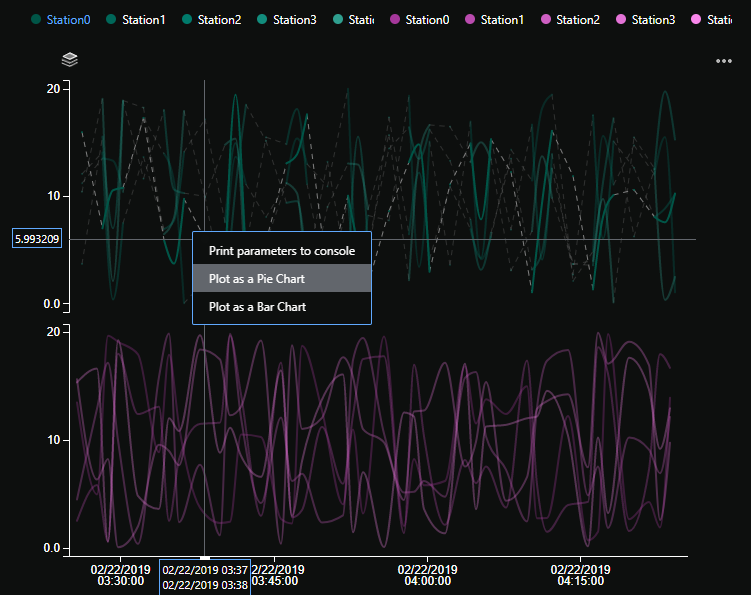
Context Menu
Render a line chart with a custom context menu
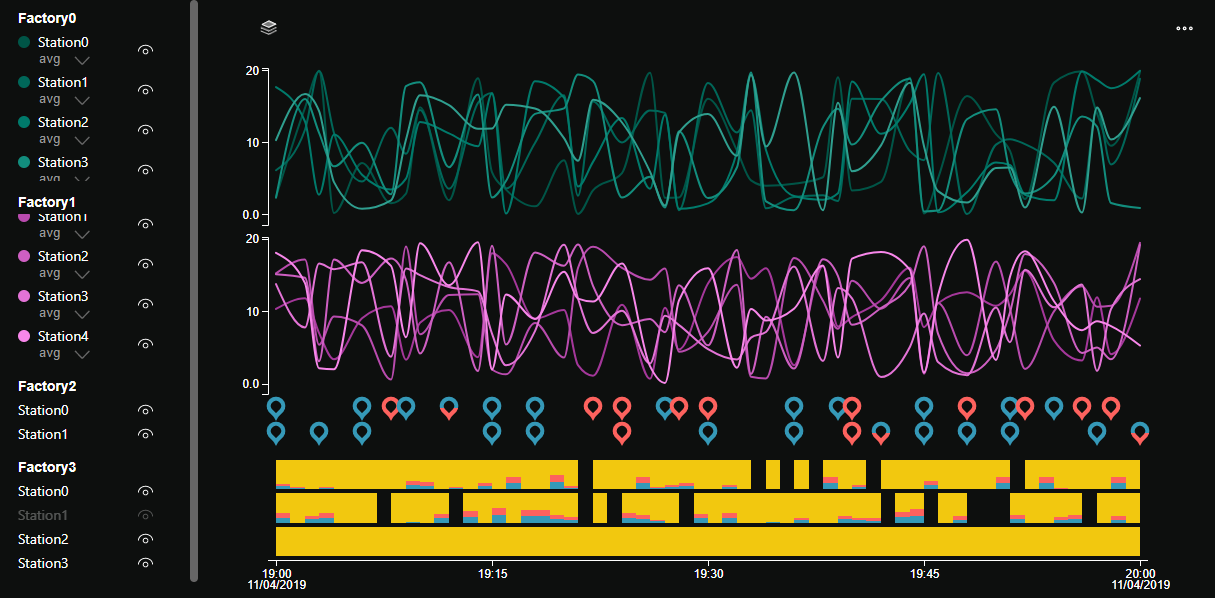
Availability and Line Charts
Render an availability chart which controls the linechart
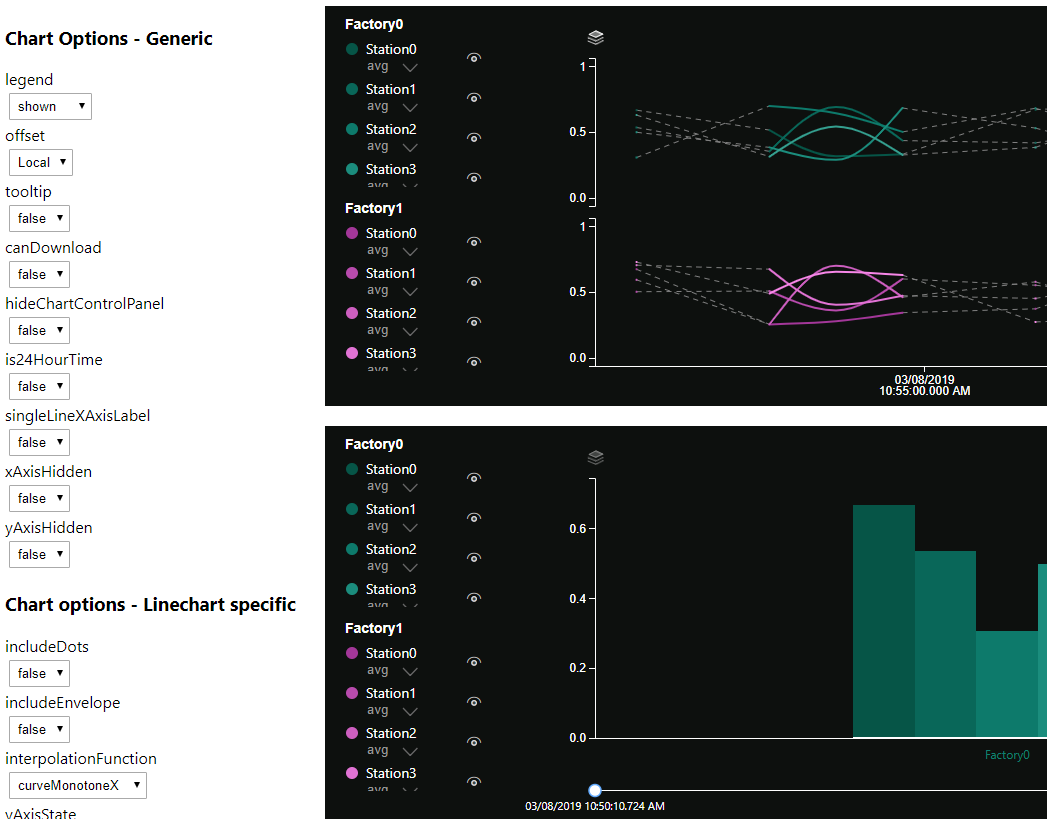
Chart Options
Test various chart options and how they affect charts
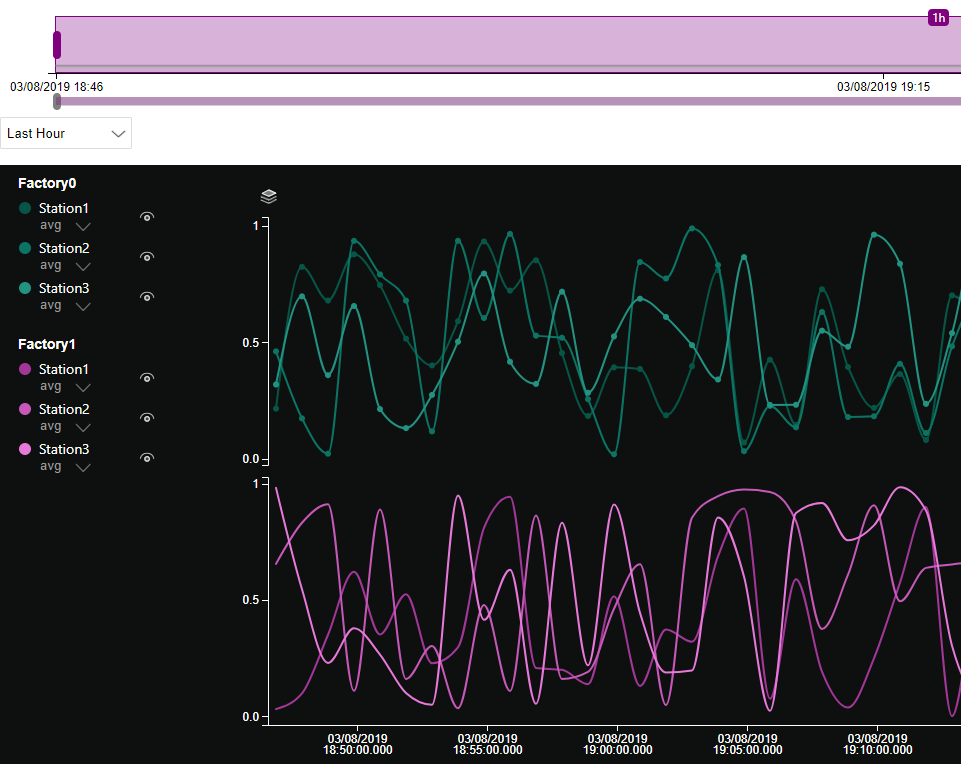
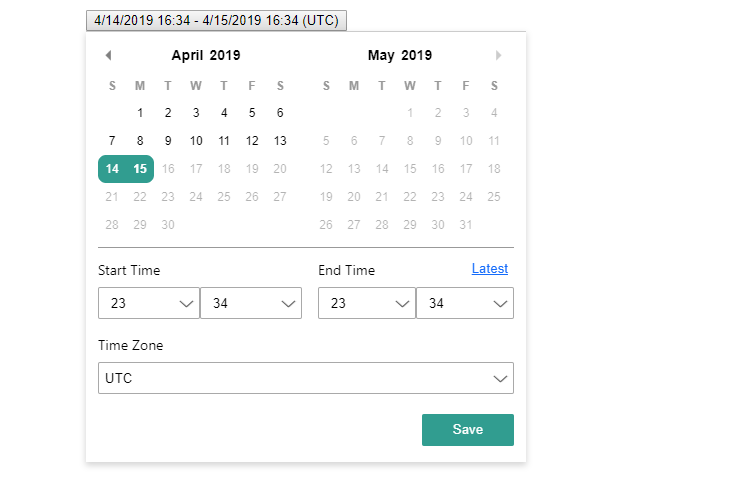
Date Time Range Picker
A standalone date time range picker
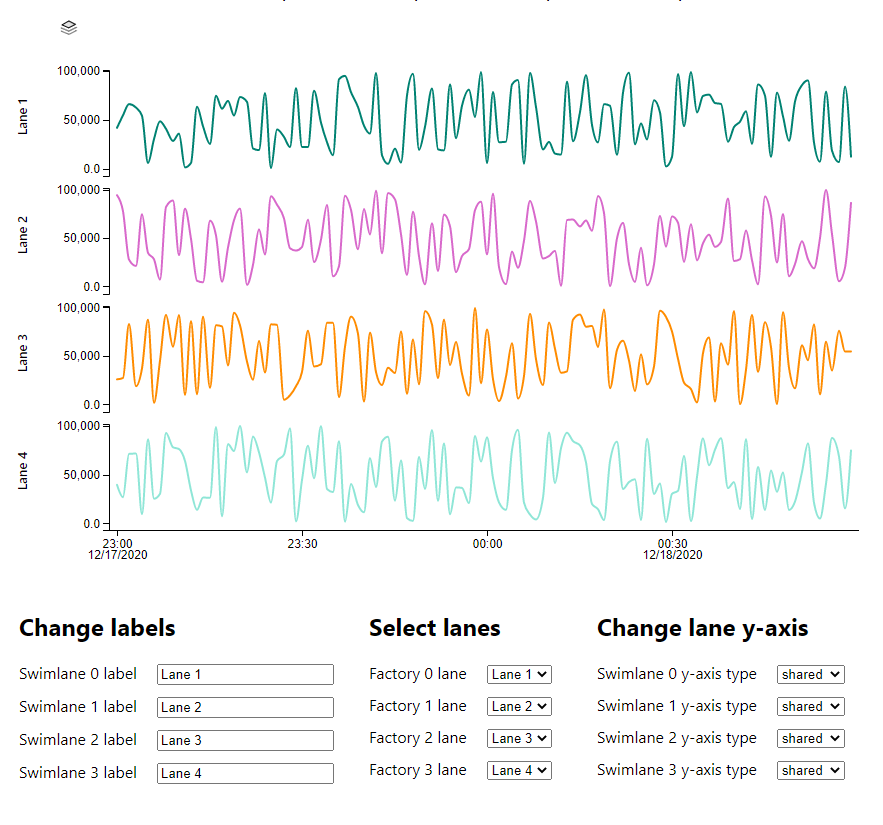
Swimlane options
Test changing lane positions, labels, and y-axis types
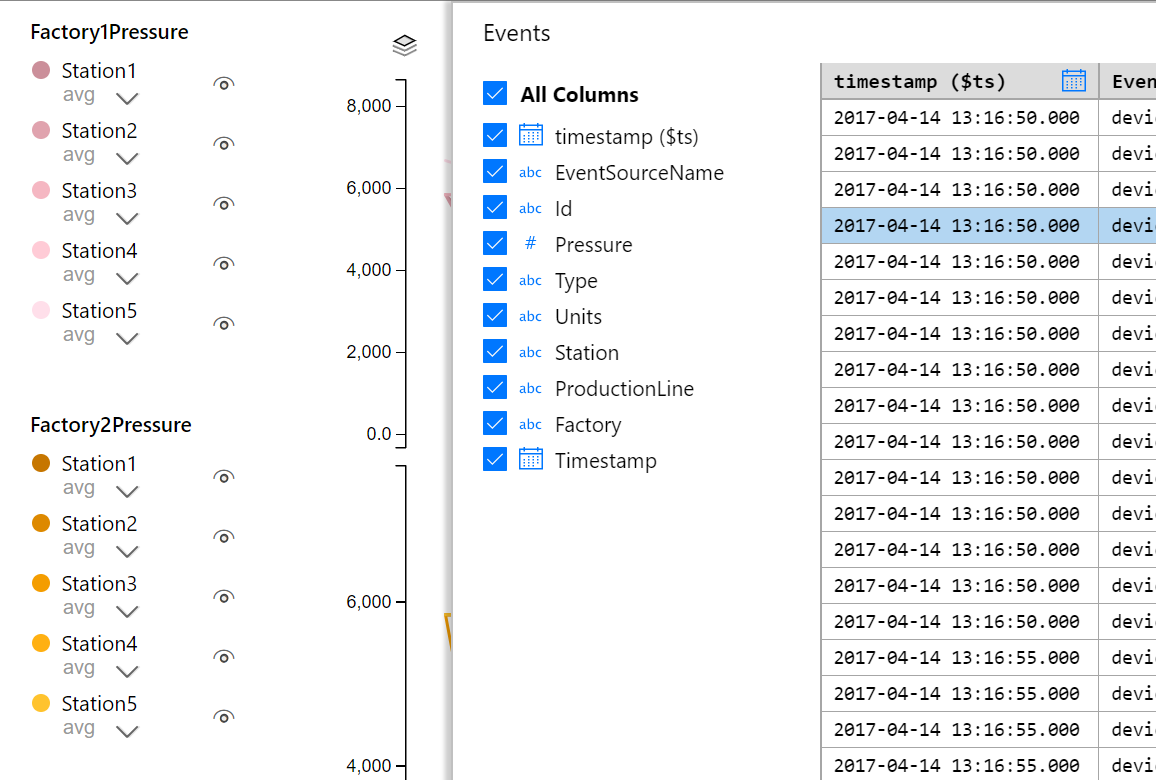
S SKU: Chart with Explore Events
Render a line chart which connects to an events table
Heatmap
Test heatmap visualization with dark and light themes
Categorical Transform
Display categorical data with custom value mappings and colors
Hierarchy Navigation
Navigate hierarchical time series data with path search
Connected Scatter Plot
Test scatter plot with connected points
Marker Interpolation
Test marker types and interpolation in line charts